Are you looking for the top WooCommerce metrics and KPIs? If you are, keep reading this article.
Running a WooCommerce store can be both exciting and daunting. Knowing where you stand is crucial in managing many aspects, from product listings to customer service.
That’s where metrics and KPIs come in.
They act like a compass for your eCommerce journey, guiding you towards success by showing you what’s working and needs improvement.
This post will explore the essential WooCommerce metrics and KPIs vital for any store owner or manager.
But before that, let’s see why you should focus on WooCommerce metrics and KPIs.
- Why You Should Focus on WooCommerce Metrics and KPIs
- Top WooCommerce Metrics and KPIs You Need to Know
- 1. Total Sales
- 2. Average Order Value (AOV)
- 3. Sales by Product
- 4. Sales by Category
- 5. Revenue per Visitor
- 6. Conversion Rate
- 7. Cart Abandonment Rate
- 8. Customer Lifetime Value (CLV)
- 9. Customer Acquisition Cost (CAC)
- 10. Retention Rate
- 11. Repeat Customer Rate
- 12. New vs. Returning Customers
- 13. Traffic Sources
- 14. Click-Through Rate (CTR)
- 15. Bounce Rate
- 16. Inventory Turnover
- 17. Stock Levels
- 18. Gross Margin
- 19. Net Profit Margin
- 20. Return on Investment (ROI)
- 21. Engagement Rate (Social Media)
- 22. Email Open Rates
- 23. Marketing ROI
- 24. Page Load Time
- 25. Customer Satisfaction Score
- Frequently Asked Questions
- Conclusion
Why You Should Focus on WooCommerce Metrics and KPIs
Understanding and focusing on WooCommerce metrics and KPIs is fundamental for any online store owner looking to thrive in the competitive eCommerce landscape.
Metrics provide a quantitative measure of where your business stands, while KPIs help you evaluate your progress toward strategic goals, highlighting areas that need attention or improvement.

Focusing on these indicators allows you to identify what’s working well, such as which products are your best sellers or which marketing campaigns are generating the highest ROI. This knowledge helps optimize your product offerings and fine-tune your marketing strategies to attract more of the right customers.
By analyzing data like customer lifetime value, cart abandonment rates, or customer satisfaction scores, you can enhance the user experience on your site. This could mean improving site speed, simplifying the checkout process, or personalizing customer interactions – all of which can lead to higher conversion rates and customer loyalty.
Now you know why you should look into WooCommerce metrics and KPIs. Next, let’s look at the top metrics you should know and optimize.
Top WooCommerce Metrics and KPIs You Need to Know
Here are the top 25 metrics you should be looking at:
- Total Sales
- Average Order Value (AOV)
- Sales by Product
- Sales by Category
- Revenue per Visitor
- Conversion Rate
- Cart Abandonment Rate
- Customer Lifetime Value (CLV)
- Customer Acquisition Cost (CAC)
- Retention Rate
- Repeat Customer Rate
- New vs. Returning Customers
- Traffic Sources
- Click-Through Rate (CTR)
- Bounce Rate
- Inventory Turnover
- Stock Levels
- Gross Margin
- Net Profit Margin
- Return on Investment (ROI)
- Email Open Rates
- Marketing ROI
- Page Load Time
- Customer Satisfaction Score
Below, we will show you what each metric has to offer.
1. Total Sales
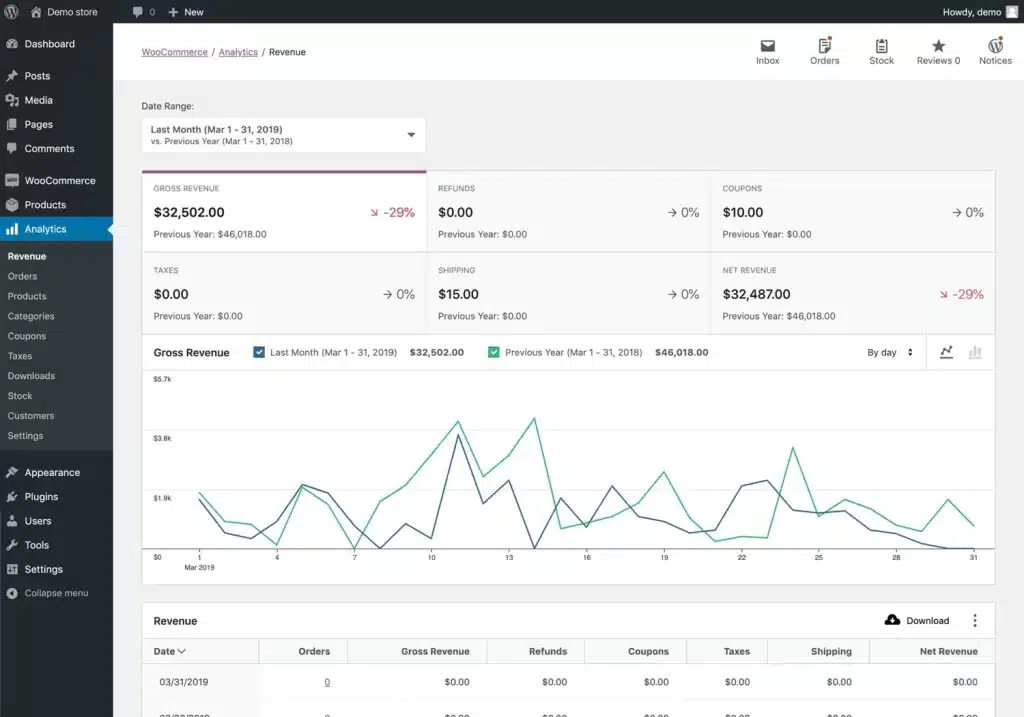
This metric represents the sum of all revenue generated through sales within a given timeframe, clearly indicating your store’s financial performance. It’s invaluable for assessing growth, setting financial targets, and understanding your business’s health.
Monitoring changes in total sales can also help in seasonal planning or reacting to market changes.
2. Average Order Value (AOV)
AOV calculates the average amount spent each time a customer completes a purchase on your WooCommerce site. It’s a critical metric for revenue optimization as it shows how much value you’re extracting from each transaction.
Strategies like cross-selling, upselling, or offering minimum spend incentives can directly influence this number, increasing revenue without necessarily increasing the number of customers.
3. Sales by Product
This KPI breaks down your revenue by individual products, offering insights into which items are your top performers and which might lag.
This information is vital for inventory management, deciding on product promotions, or even contemplating discontinuing underperforming items. It helps tailor your sales strategy to focus on high-margin or high-demand products.
4. Sales by Category
By analyzing sales according to product categories, you gain a broader perspective on which areas of your store contribute most to your revenue.
This metric aids in strategic decisions like where to allocate marketing resources, how to organize your site’s navigation, or which categories to expand or reduce based on performance.
5. Revenue per Visitor
This metric reveals how effectively you monetize site traffic by dividing total revenue by the number of visitors. It’s an excellent indicator of your website’s sales efficiency, showing whether your marketing efforts translate into sales or if there’s room for improvement in conversion tactics or user experience.
6. Conversion Rate
This percentage reflects how many site visitors turn into customers by purchasing. It’s a vital sign of your store’s performance in terms of UX, product appeal, and marketing effectiveness.
A low conversion rate might signal poor site navigation, unclear product descriptions, or ineffective calls to action.
7. Cart Abandonment Rate
When customers add items to their cart but leave without completing the purchase, this metric captures that loss.
High abandonment rates can indicate problems like a complicated checkout process, unexpected costs, or lack of trust signals. Addressing these issues can significantly recover potential lost sales.
8. Customer Lifetime Value (CLV)
CLV forecasts the total revenue you can expect from a single customer throughout their relationship with your store.
It’s pivotal for evaluating customer acquisition costs against long-term benefits, influencing everything from marketing to customer service strategies to maximize the value of each customer.
9. Customer Acquisition Cost (CAC)
This KPI measures how much you spend to acquire each new customer, including all marketing and sales expenses.
Comparing CAC to CLV gives you a clear picture of your investment’s sustainability in customer acquisition, guiding decisions on budget allocation and marketing channel effectiveness.
10. Retention Rate
It shows how well you’re keeping customers over time. High retention rates suggest customer satisfaction, effective loyalty programs, and successful post-purchase engagement, all essential for sustained business growth.
11. Repeat Customer Rate
This metric specifically tracks the percentage of sales from customers who have bought from you. It’s a testament to customer loyalty and the effectiveness of your efforts in encouraging repeat business through quality service, product satisfaction, or loyalty incentives.
12. New vs. Returning Customers
Understanding the balance between new and returning customers helps you gauge your growth potential and customer loyalty. A healthy mix indicates effective new customer acquisition while maintaining engagement with existing ones.
13. Traffic Sources
Knowing where your visitors come from (organic search, social media, paid ads, or referrals) allows you to optimize your marketing spend and strategy. It’s about doubling down on what works and reevaluating or eliminating what doesn’t.
14. Click-Through Rate (CTR)
In marketing, CTR measures the percentage of people who click on your ads or links. It directly indicates how compelling your promotional content is, influencing your SEO and PPC strategy effectiveness.
15. Bounce Rate
A high bounce rate means many visitors leave after viewing just one page, which could point to issues with content relevance, site speed, or user experience. Reducing the bounce rate often leads to higher engagement and better conversion rates.
16. Inventory Turnover
This ratio shows how often you sell and replace inventory over a period. It’s key for understanding inventory management efficiency, highlighting whether you’re overstocking, understocking, or managing stock optimally.
17. Stock Levels
Monitoring stock levels ensures you meet customer demand without overstocking. It helps in cash flow management, reduces storage costs, and prevents both stockouts and excess inventory, directly impacting customer satisfaction and operational costs.
18. Gross Margin
This KPI shows the difference between revenue and the cost of goods sold, expressed as a percentage. It’s crucial for understanding profitability at the product level, helping in pricing strategies and product selection.
19. Net Profit Margin
After accounting for all expenses, this shows what percentage of your revenue is profit. It’s a comprehensive measure of your business’s financial health and efficiency.
20. Return on Investment (ROI)
ROI measures the profitability of specific investments in your store, like new marketing initiatives or site improvements. A positive ROI means those investments are paying off, guiding future investment decisions.
21. Engagement Rate (Social Media)
For social media marketing, this metric indicates how users interact with your content, whether through likes, shares, comments, or clicks. High engagement rates are signs of strong brand visibility and community interaction.
22. Email Open Rates
This shows how effectively your email campaigns capture attention, indicating whether your subject lines and sender reputation resonate with your audience.
23. Marketing ROI
Specifically, it assesses the return on marketing dollars spent. Understanding which marketing strategies yield the best financial returns is crucial in helping optimize marketing budgets.
24. Page Load Time
A technical metric that directly affects user experience, faster load times can significantly reduce bounce rates, increase engagement, and improve conversion rates.
25. Customer Satisfaction Score
Often gathered through surveys, this metric measures customers’ satisfaction with their experience. High satisfaction scores correlate with higher customer retention, positive word-of-mouth, and brand loyalty.
Frequently Asked Questions
Next, let’s see some frequently asked questions regarding this topic.
Metrics are crucial because they give a snapshot of your store’s performance. By understanding metrics like total sales, conversion rates, or customer lifetime value, you can make better decisions about where to focus your efforts for growth.
Reviewing your KPIs at least monthly is beneficial, but weekly checks can help you respond promptly to trends for metrics like sales and traffic. The frequency might increase during sales events or if you’re launching new products or campaigns.
Absolutely. Metrics like bounce rate, page load time, and customer satisfaction scores directly reflect the user experience. By monitoring these, you can identify issues like slow pages or confusing navigation, leading to enhancements that make shopping on your site more enjoyable.
While WooCommerce provides some basic analytics, you might want to integrate tools like Google Analytics or use WooCommerce-specific plugins for a comprehensive view. These tools help automate data collection and provide more detailed insights into your store’s performance.
Conclusion
Focusing on these 25 WooCommerce metrics and KPIs can transform how you manage and grow your online store.
They’re not just numbers but insights into your business’s health, customer behavior, and operational efficiency. Regularly analyzing these metrics allows you to spot trends, capitalize on opportunities, and address issues before they become problematic.
Remember, the key to eCommerce success lies in understanding your data and using it to make strategic decisions. Keep learning, keep tracking, and let these metrics guide you to a thriving WooCommerce business.
Do you know any other WooCommerce metrics that can be used?
Let us know in the comments.
Also, if you prefer video content over written tutorials, please check out our YouTube channel.
